Dashboard Overview
Dashboard Overview
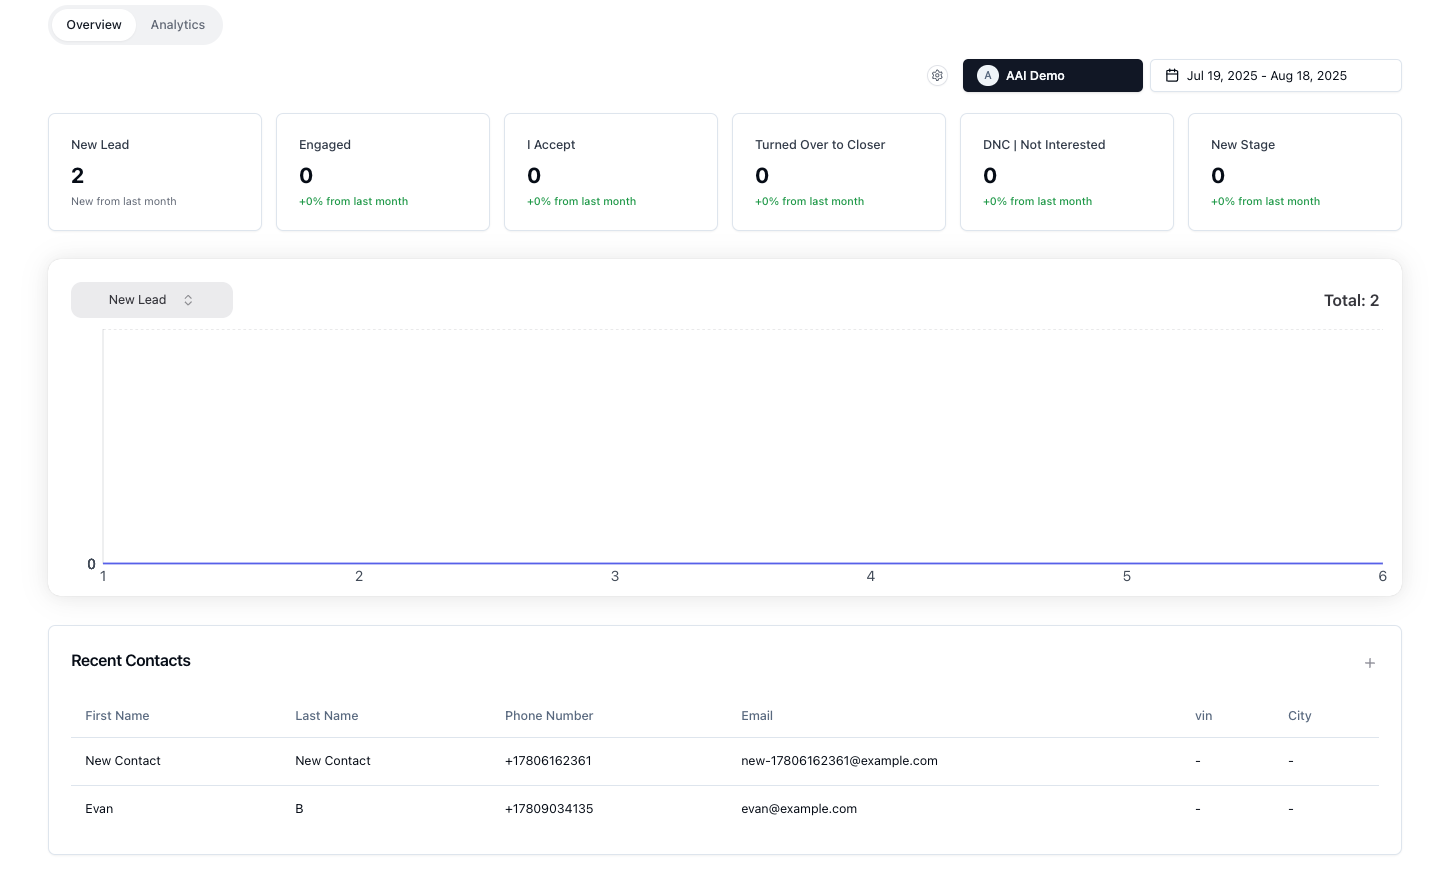
Section titled “Dashboard Overview”Purpose: High-level KPIs and activity snapshots.
Explanation: One-page view of headline metrics, pipeline metrics, and activity. Switch User/Team/Dealership filters and date ranges to get the right lens.
When to use: Daily and weekly performance reviews.
Prerequisites: Connected data sources; correct user/team/dealership filter.
Quick start
Section titled “Quick start”-
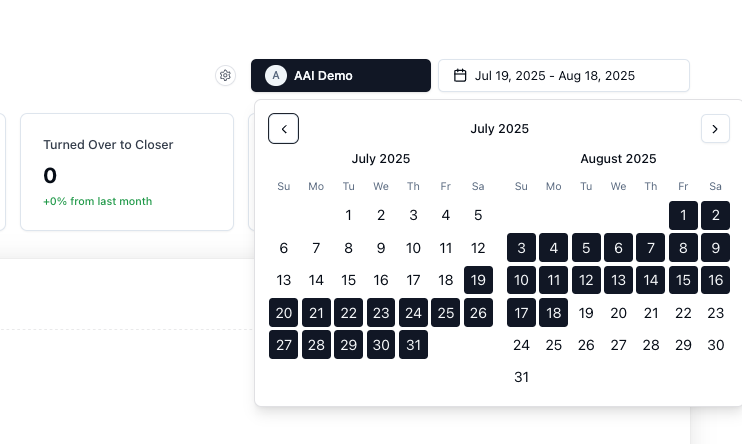
Select your filter (User, Team, Dealership) and date range.
-
Review Overview metrics and pipeline stages; adjust visible stages if needed.
-
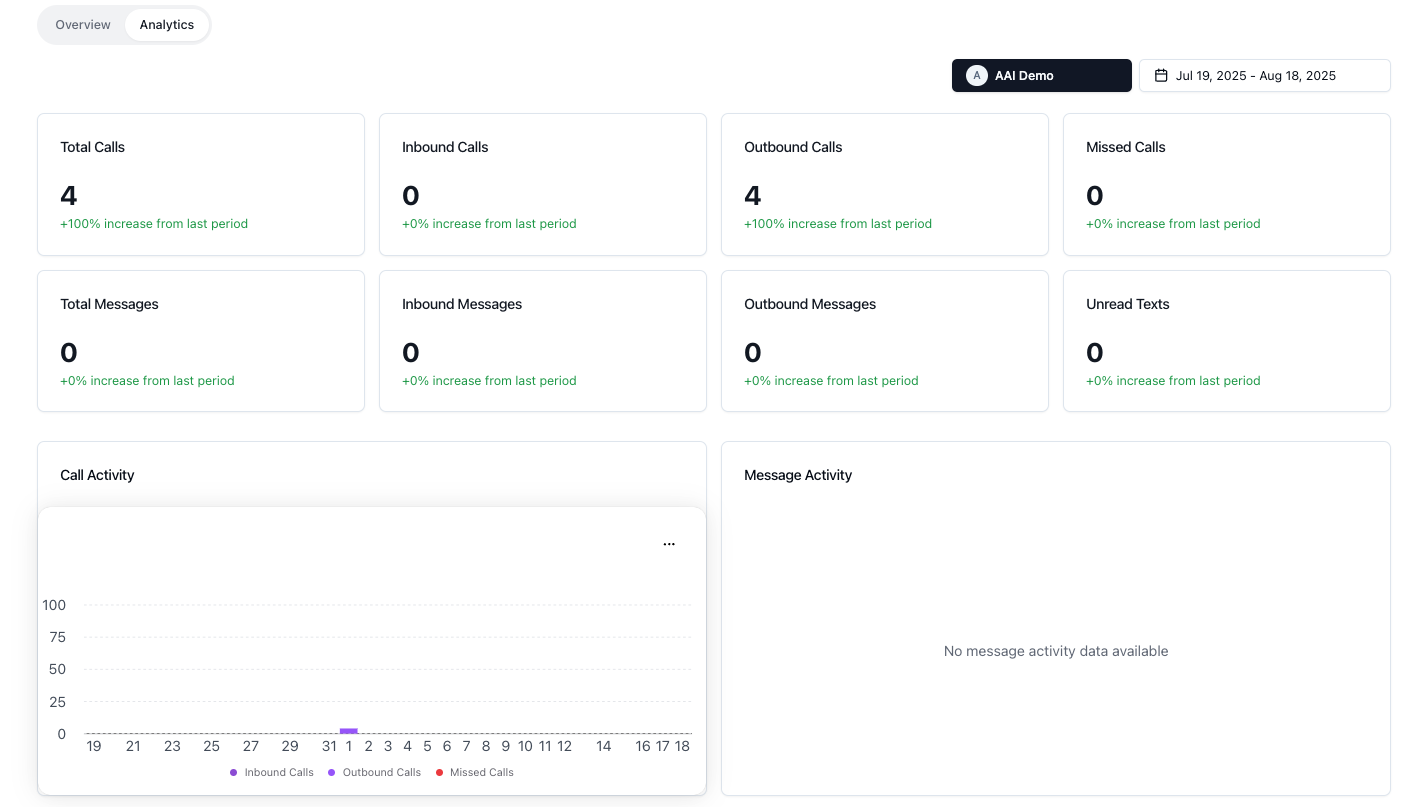
Open Analytics to review call/message activity and team performance.
-
Capture insights and assign action items to owners.
Main Sections
Section titled “Main Sections”1. Dashboard Filters
Section titled “1. Dashboard Filters”Open /dashboard and select your filter (User, Team, Dealership) and date range.
2. Overview
Section titled “2. Overview”Review headline metrics and pipeline metrics; adjust visible stages if needed.

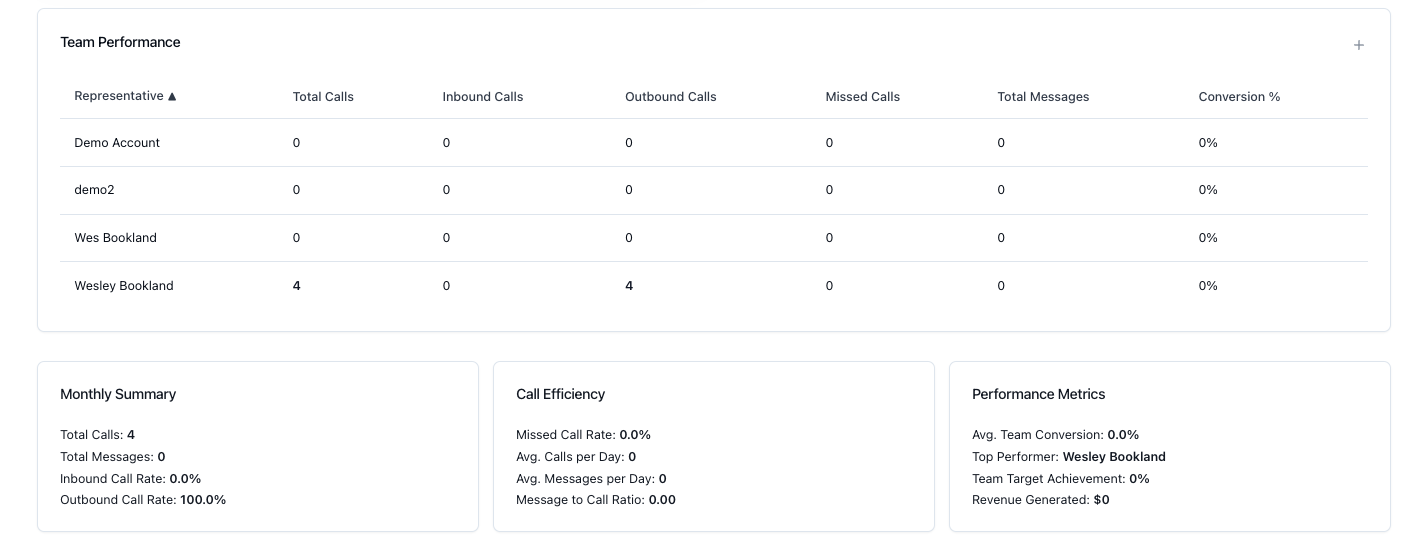
3. User Analytics
Section titled “3. User Analytics”Review call/message activity, team performance, and summaries.
4. Action Items
Section titled “4. Action Items”Capture insights and assign action items to owners.
Quality Checks
Section titled “Quality Checks”- Filters and date range are correct.
- Visible pipeline stages reflect current desired information.
Common Issues & Fixes
Section titled “Common Issues & Fixes”- No data → check filter selection and date range; verify sources.
- Odd team metrics → ensure the selected team actually has data.
Escalation Guidelines
Section titled “Escalation Guidelines”- KPI drops or anomalies → escalate to leadership with context.
Key Metrics
Section titled “Key Metrics”- Total new contacts, closed, pipeline stage counts, call/messages.
Shortcuts & Links
Section titled “Shortcuts & Links”- Page: /dashboard
- URL: https://app.automotiveai.ca/dashboard
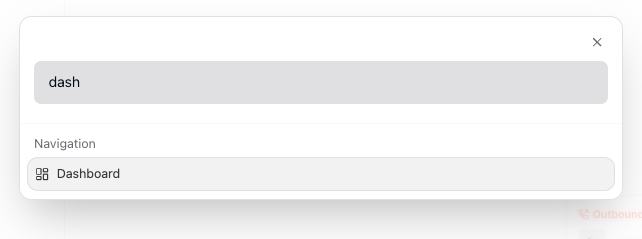
- Open Command Bar: Cmd (Mac) / Ctrl (Windows) + K: Dashboard